Wednesday, November 13, 2013

SCOM System Center Management Service is now Microsoft Monitoring Agent

Microsoft Monitoring Agent is a new agent that replaces the Operations Manager Agent and combines .NET Application Performance Monitoring (APM) in System Center with the full functionality of IntelliTrace Collector in the Microsoft Visual Studio development system for gathering full application-profiling traces. Microsoft Monitoring Agent can collect traces on demand or can be left running to monitor applications and collect traces. You can limit the disk space that the agent uses to store collected data. When the amount of data reaches the limit, the agent begins to overwrite the oldest data and store the latest data in its place.
You can use Microsoft Monitoring Agent together with Operations Manager or as a stand-alone tool for monitoring web applications that were written on the Microsoft .NET Framework. In both cases, you can direct the agent to save application traces in an IntelliTrace log format that can be opened in Microsoft Visual Studio Ultimate. The log contains detailed information about application failures and performance issues.
You can use Windows PowerShell commands to start and stop monitoring and collect IntelliTrace logs from web applications that are running on Internet Information Services (IIS). To open IntelliTrace logs that are generated from APM exceptions and APM performance events, you can use Visual Studio. For information about supported versions of IIS and Visual Studio, see Microsoft Monitoring Agent Compatibility.

Friday, July 19, 2013

SCOM 2012 Upgrade ACS Schema does not Update

I didn't write the blog post, but I did experience the issue, and it is worth repeating. It seems this is going to affect anyone upgrading from SCOM 2012 to SP1 who uses ACS. The issue is that the schema doesn't get updated, causing crashes to ADTServer. If you want to full details, you can refer to this blog post http://nocentdocent.wordpress.com/2013/02/12/sysctr-2012-sp1-acs-upgrade-error-scom-sysctr/.

Here are the steps you need to take, assuming you are having the issue. Again, if you are not sure you are having the issue, refer to the post above.

  1. Check the current Schema version of ACS
    1. Open SQL Management Studio
    2. Run the query Select * FROM dtConfig
    3. Check the row with a comment called "database schema version"
    4. Make sure it is at version 7. If it is at version 7, continue. If not, do NOT do the rest of the steps.
  2. Backup your ACS Database (Mine is Called OperationsManagerAC)
  3. Find the SQL script called DbUpgV7toV8.sql
  4. Making the assumption you already upgraded ACS, you can find the script in C:\Windows\System32\Security\AdtServer
  5. Execute the script against your acs database
  6. You might have to give it a day or so before another partition is created. If you don't receive any errors, you should be good.

Friday, May 3, 2013

Create and Assign Service Manager Incidents Directly from SCOM on Demand

Update:
As you read through below, you will notice that Microsoft has been nice enough to use some of the IDs I was using with the release of SP1. (This post was pre SP1) You will have to make small modifications to your script and Ids but the below solution still works.

The Issue
If you use Operations Manager and Service Manager, you know by now that SCOM will automatically create Incidents in Service Manager. However, for most organizations, this just doesn’t make sense because they do not have a 1-to-1 Alert-to-Action ratio. You can set up basic criteria to limit the automatic creation, but this usually still results in too many unnecessary incidents. As a result, most organizations do not utilize this connector, which at one point was one of the most requested features of SCOM – to do really cool things with ticketing systems.
The Solution
So, instead, I have created a solution that will allow you to create incidents on demand directly from a SCOM Alert, while utilizing all the cool features of the Service Manager SCOM Alert connector. All you have to do is right click the alert(s) to create the on-demand tickets.
What are some features of the solution in conjunction with the native Connector:
  • Right click one more multiple alerts and assign incidents directly to the specified group/user
  • Closing the alert closes the ticket and vice-versa
  • The Assigned User and the Ticket Id are maintained in the alert as sourced from SCSM
  • The affected component in SCOM is automatically added as a related configuration item in SCSM
  • Easily can be extended to do more fun stuff with only basic PowerShell Knowledge
How Does it Work
The solution utilizes the following components:
  1. SCOM and SCSM obviously
  2. A very small PowerShell Script
  3. SCOM CMDLETS
Workflow:
  1. A user right clicks the alert and sets the resolution State.
  2. A Command Subscription triggers based on the resolution state, sets a couple of custom fields, and changes the resolution state to “Generate Incident” a
  3. The SCSM Alert connector triggers based on the new resolution state, generates an incident, and applies an incident template based on data in the custom fields.

How to Implement the Solution

These Steps need to be performed in SCOM

Step One
Copy the following PowerShell script code and save on your SCOM management server as UpdateCustomFieldPowershell.ps1. (I took this code from another blog online and modified it as my own. Unfortunately, I don’t know who wrote the original script.)

Param($alertid) 
$alertid = $alertid.toString()
write-eventlog -logname "Operations Manager" -source "Health Service Script" -eventID 1234 -entrytype "Information" -message "Running UpdateCustomFieldPowershell"
Import-Module OperationsManager; "C:\Program Files\System Center 2012\Operations Manager\Powershell\OperationsManager\Functions.ps1"; "C:\Program Files\System Center 2012\Operations Manager\Powershell\OperationsManager\Startup.ps1"
$alert = Get-SCOMAlert -Criteria "Id = '$alertid'"
write-host $alert
If ($alert.CustomField2 -ne "AlertProcessed")
    {
$AlertResState = (get-SCOMAlertResolutionState -ResolutionStateCode ($Alert.ResolutionState)).Name
$AlertResState
   # $alert.CustomField1 = $alert.NetBIOSComputerName
     $alert.CustomField1 = $AlertResState
     $alert.CustomField2 = "AlertProcessed"
$alert.ResolutionState  = 254
    $alert.Update("")
    }
exit

Step Two
We need to create some new alert resolution states. The alert resolution states will trigger the script. You want to create a resolution state for each support group you would assign an alert. You can use whatever format you want. I used the format of “Assign to GROUPNAME”. Also keep in mind the Resolution State Ids and order you will use. I made my alphabetical. DO NOT use the resolution state 0,1,254, or 255.
To create new resolution states:
  • Go to the SCOM Console
  • Go to the Administration Workspace
  • Go to Settings
  • Select Alerts
  • Select the new button, create a resolution state and assign an Id. Resolution states will always be ordered by their Id
  • Repeat for each resolution state
After you create your alert resolution states, you will need to create one more that triggers the SCSM Connect. Name this Alert Resolution State “Generate Incident.” Also, make sure this is the exact name as the script requires. If you want to change the name, you will have to update the script. Also, set the Id to 254.
Step Three
We need to set up a command channel and subscription that will trigger and run the script.
  • Open the SCOM Console
  • Go the the Administration Workspace
  • Go to Channels
  • Create a new Command Channel
  • Enter the full path of the above script
  • Enter the command line parameters as shown in the example below (Be sure the use the double and single quotes correctly)
    • "C:\OpsMgrProductionScripts\SCOMUpdateCustomField.ps1" '$Data/Context/DataItem/AlertId$'
  • Enter the startup folder as C:\windows\system32\windowspowershell\v1.0\
  • Save the new Channel
Next, we need to set up the subscriber for the command channel.
  • Open the SCOM Console
  • Go the the Administration Workspace
  • Open subscribers
  • Create a new subscriber
  • In the addresses tab, click Add
  • In the subscriber address, set the channel type to command and then select the channel you set up in the previous steps.
  • Save the address and the subscriber
Next, we need to set up the Command Subscription
  • Open the SCOM Console
  • Go the the Administration Workspace
  • Open Subscriptions
  • Create a new Subscription
  • On the subscription criteria, check the checkbox “with a specific resolution state
  • Select all the new resolution states except “Generate Incident” (Do not select anything other than the assignment states)
  • On the subscribers, add the new subscriber you created in the previous steps
  • On the Channels, add the new channel you created in the previous steps
  • Save the subscription
Step Four
The last thing we have to do in SCOM is set up the Alert connector. The alert connector will be triggered based on the resolution status of “Generate Incident”.
  • Open the SCOM Console
  • Go the the Administration Workspace
  • Go to connectors and select Internal Connectors
  • Open the SCSM Alert Connector
  • Create a new subscription in the connector
  • In the criteria of the subscription

These Steps need to be performed in SCSM 

Step One
The first thing you want to do is enable and connect your SCSM SCOM Alert Connector. If you do not know how to do that, you can refer to technet. http://technet.microsoft.com/en-us/library/hh524325.aspx. Verify it works before moving any further.
Step Two
  • Create a new Management Pack dedicated to storing the SCOM Incident Templates in SCSM
  • Create a SCOM incident template for each group that you want to assign via SCOM. Typically, this is about 10-20 templates. For testing purposes, I would just start with one or two.
  • Add the correct group as the assigned to in each template. It is not necessary to fill any other information.
Step Three
  • In SCSM open the SCOM Alert Connector
  • Go to the alert routing rules and add a new rule
    • For each rule select one of the templates that you created
    • On the select criteria type, select the Custom Field radio button
    • For custom field one, enter the exact name of the resolution state you used in SCOM. For example, if you are going to assign to the server team, and the name of resolution state is called “Assign to ServerTeam”, this is the exact phrase you need to enter into Custom Field one.
  • Select Custom Field two from the drop down
  • For custom field two, enter “AlertProcessed”
  • Click OK
  • Repeat for each template

Time for Testing! 

Now you are ready to test. Find an alert in SCOM, right click the alert and set it to a resolution state for assignment. Give the subscription time to run and the SCSM connector time to run. Usually, if the connector is running every 2 minutes, it takes the total process about 5 minutes to complete. While the actual workflows are running in a second, it simply takes time for both of them to trigger.

Troubleshooting

If there are any issues with the configuration, the event logs will usually tell you about failures. If it is not working, but you don’t see any failures, your criteria probably do not match.

Conclusion

This is a great alternative solution to automatically creating tickets from SCOM. You can still automatically create tickets as well simply by adding subscriptions to the SCSM SCOM Alert connector. If you have any issues, question, leave a comment.

Wednesday, February 27, 2013

SCOM Availability Report Monitoring Unavailable SOLVED (Unsupported)

I have seen numerous posts floating around regarding the SCOM Availability Reports showing "Monitoring Unavailable" even though the objects were healthy for the time period. For example, I can run the SCOM Availability Report, select "Exchange 2007 Service”, select the date range and expects lots of green, yellow, and red, but instead I primarily see dark gray.

The issue could be caused by the following:

  • Bad Calculations during health rollups
  • Bad Performance
  • The Data Warehouse is behind
  • and others

Several blog posts already exist regarding the above issues and can be found with Google/Bing. We will not be addressing those specific issues. We will be dealing with a very specific issue, which as far as I can tell is a bug, but I am not going to hold my breath.

Data Warehouse Availability Aggregation Process

SCOM has a process called the Data Warehouse Availability Aggregation Process. The Data Warehouse Availability Aggregation Process is somewhat complicated with about 10 steps that you probably don't care about. If you do, you can check this diagram, which gives a fairly decent picture of what is going on in the process.

Remember the issues various people continue to have with Management Server Resource Pools becoming unavailable in SCOM 2012? That resource pool unavailability is calculated just like any other object. Inside the Data Warehouse, a table called "dbo.HealthServiceOutage" keeps the outage data when this occurs on all objects. However, sometimes, it forgets to enter an outage end time.  And that is the key to our current issue.

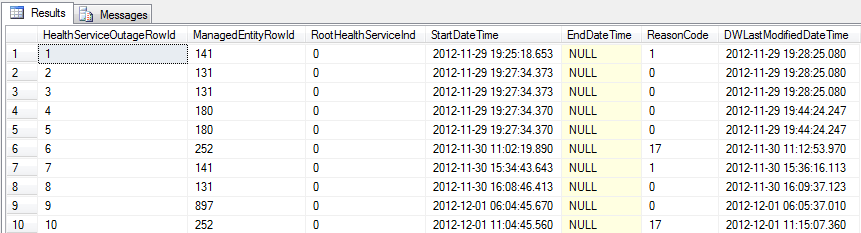
So lets take a look at the Health Service Outage table.

Select top 10 * FROM dbo.HealthServiceOutage with ( NOLOCK )


You can see how each managed entity has reason for the outage, start time, and end time. However, in some cases, the end time will be NULL.


There are two reason for this.
  1. The object that is "unavailable" is truly still unavailable. This SHOULD be NULL.
  2. The object is now healthy, but an EndDateTime did not get written. Unless you have a big problem in your environment, you should have very few of these.
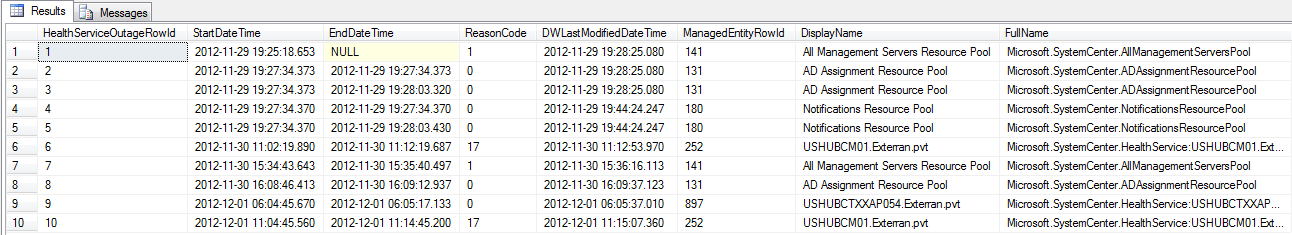
A bunch of Ids doesn't get us very much information, so lets enhance the query a bit. This query shows us ONLY the items with a NULL EndDateTime. It is also joined to the ManagedEntity table so we can see the actual names of the objects.

Select h.HealthServiceOutageRowId, h.StartDateTime, h.EndDateTime, h.ReasonCode, h.DWLastModifiedDateTime, me.ManagedEntityRowId, me.DisplayName, ME.FullName
FROM dbo.HealthServiceOutage h with ( NOLOCK )
JoinManagedEntity me on h.ManagedEntityRowId = me.ManagedEntityRowId
WhereEndDateTime IS NULL


Notice the "All Management Servers Resource Pool" EndDateTime is NULL. Assuming it is actually available, this should have the actual end date.
The Health Service Outage data is considered in the availability calculations of the Standard Data Set in the Data Warehouse. If you look at any of the State.StateDaily_[GUID] tables, you will see the "HealthServiceUnavailableMilliseconds" column is always maxed out, assuming the other columns are 0. We can make the Data Warehouse recalculate this data by modifying the "Health Service Outage" table.

If you want to make your objects available again, you can follow the steps below. Please note:
  1. This is NOT supported by Microsoft
  2. You SHOULD backup your Data Warehouse before making any changes
  3. After we make the changes, you Data Warehouse might have to do A LOT of recalculate, causing a kick in performance for a short period of time, or it might cause you data warehouse to fall behind for a little while. If you are having performance issues with your Data Warehouse, you should address them first.
 

How to Make my objects available again in SCOM Availability Reports

BACKUP YOUR OPERATIONSMANAGERDW DATABASE

Open SQL Management Studio and connect to your OperationsManagerDW
The first thing we want to do, is make sure your Data Warehouse is not behind. Run the below query. If you get more than one of two rows, then follow this article and catch up your data warehouse.

DECLARE @DatasetId uniqueidentifier
SELECT
@DatasetId = DatasetId
FROM Dataset d
WHERE (d.DatasetDefaultName ='State data set')
SelectAggregationDateTime, AggregationTypeId
FromStandardDatasetAggregationHistory
Where DatasetId = @DatasetId
And
DirtyInd = 1


Assuming your data warehouse is not behind, let's continue. Paste and run the following query into SQL Management Studio.

Select h.HealthServiceOutageRowId, h.StartDateTime, h.EndDateTime, h.ReasonCode, h.DWLastModifiedDateTime,
me.ManagedEntityRowId, me.DisplayName, ME.FullName
FROM dbo.HealthServiceOutage h with ( NOLOCK )
Join ManagedEntity me on h.ManagedEntityRowId = me.ManagedEntityRowId
Where  DisplayName = 'All Management Servers Resource Pool' and EndDateTime IS NULL


If you have results, then you have an EndDateTime that is NULL. Before assuming that is should not be NULL, you should go into SCOM and verify the state of the object first to make sure it is available. If the state of the object is available, but your query returned one or more NULL EndDateTime entries, then lets continue.

Now we need to update the HealthServiceOutage table and enter an EndDateTime for the results above. The query below does the following:
  1. Gets the rows from the query above
  2. Updates the DWLastModifiedDateTime to the current UTC Date and Time
  3. Updates the EndDateTime to match the StartDateTime

Why are we modifying the DWLastModifiedDateTime?
We want the data warehouse to recalculate the states, so the reports accurately reflect availability. We must update this column, otherwise recalculation will not happen.

If you a savvy SQL Query person, then you can update the below query and enter an EndDateTime of your choosing in UTC. I have decided that I want to make the EndDateTime the same of the StartDateTime, because I don't really know how long the resource pool was down, but it is usually a very short time.

NOTE: THIS QUERY WILL MAKE CHANGES TO THE HEALTHSERVICEOUTAGE TABLE

Paste and execute the following query into SQL Management Studio.

Update dbo.HealthServiceOutage
SetDWLastModifiedDateTime = GETUTCDATE(),EndDateTime=StartDateTime
WhereHealthServiceOutageRowId
IN (
Select h.HealthServiceOutageRowId
FROM dbo.HealthServiceOutage h with ( NOLOCK )
JoinManagedEntity me on h.ManagedEntityRowId = me.ManagedEntityRowId
Where  DisplayName ='All Management Servers Resource Pool' and EndDateTime IS NULL)

 
If you want to verify the changes, you can run the following Query.

Select h.HealthServiceOutageRowId,h.StartDateTime,h.EndDateTime,h.ReasonCode, h.DWLastModifiedDateTime,me.ManagedEntityRowId, me.DisplayName, ME.FullName
FROM dbo.HealthServiceOutage h with ( NOLOCK )
JoinManagedEntity me on h.ManagedEntityRowId = me.ManagedEntityRowId
Where  DisplayName ='All Management Servers Resource Pool' and EndDateTime =StartDateTime
order by DisplayName


After we make the change, the next time Standard Data Set Maintenance runs, it will recalculate Availability. It will make the DW look like it is behind, but just give it time to catch up and calculate the state. This could take several hours. You can run the query below periodically and verify that your row count is getting smaller. My row count increased to about 350, and over about 12 hours reduced down to the normal one or two rows.

DECLARE @DatasetId uniqueidentifier
SELECT
@DatasetId = DatasetId
FROM Dataset d
WHERE (d.DatasetDefaultName ='State data set')
SelectAggregationDateTime, AggregationTypeId
FromStandardDatasetAggregationHistory
Where DatasetId = @DatasetId
And
DirtyInd = 1


Once the Standard Data Set calculations are finished, run your reports and verify they are no longer gray.

On another note, the above steps will work for objects other than the Resource Pool. However, the resource pool is what caused ALL of my objects to be gray in reports. It is possible that other objects with NULL EndDateTime entries can cause that specific object to be gray in a report. I also had other objects that did not have an EndDateTime properly set. So, for each of the objects, I simply verified the were available in SCOM, then I set the EndDateTime and the DWLastModifiedDateTime. Remember, if an object in SCOM is unavailable then the EndDateTime SHOULD BE NULL.


Friday, February 22, 2013

Enter a Group into Maintenance Mode using SCOM the Console (No Scripts Required)

I know this is a short post, but the idea is simplicity. Sometimes, we make things unnecessarily too complicated, and native functionality is sometimes overlooked. As a consultant, I strive to keep solutions for my customers as simple as possible while providing the required functionality.

Posts regarding group or class maintenance mode using powershell, scripts, new management packs, and otherwise complicated solutions are all over the internet. Is it really necessary to go to all this trouble? Not really. Yes, I use powershell to enter groups into maintenance mode for certain reasons, such as scheduled patching. But not everyone is a SCOM/scripting guru, and wants to use powershell.

I never see posts about entering groups into maintenance mode using the SCOM Console. It's simple, quick (much quicker than powershell), and effective.
There a couple of ways to enter a group into maintenance mode, but I will cover a single easy way - use discovered inventory.

How to enter a Group into Maintenance Mode the Easy Way

  1. Open the SCOM Console
  2. Go the the Monitoring Pane
  3. Select "Discovered Inventory"
  4. Select "Change Target Type"
  5. Type in your Group Name
  6. Select it and click OK
  7. On the Discovered Inventory View, select your Group
  8. Click "Start Maintenance Mode"
  9. Edit the Maintenance Mode Settings
  10. Click OK
  11. VIOLA!
  12. SIMPLE!
  13. DONE!

A simple post for a simple, yet effective solution using native features of SCOM.If you need some help or have any questions, leave a comment and I will be happy to help.

Thursday, January 17, 2013

Create Quest Event-o-Pedia Online Event Search View in SCOM

Quest software has a nice online website that allows easy searching or browsing of events. While it contains almost all windows events, it also contains events from VMWare and Juniper. I thought this would be a nice little utility to have in a SCOM view, so I created a SCOM webpage view with the advanced search. Here's how you do it.
http://eventopedia.cloudapp.net/

The webpage: http://eventopedia.cloudapp.net/Advanced_Search.aspx


 Open SCOM, go to Monitoring, right click the top Monitoring View, New, Web Page View


Enter a name and the link, click ok.


Tuesday, January 15, 2013

SCOM Agent Supported in SCSM 2012 SP1


System Center 2012 – Operations Manager
System Center 2012 – Operations Manager agents were not supported with System Center 2012 – Service Manager. However, the agent that is automatically installed by System Center 2012 – Service Manager SP1 is compatible with System Center 2012 – Operations Manager and System Center 2012 – Operations Manager SP1.  After Service Manager Setup completes, you must manually configure the agent to communicate with the Operations Manager management server.
To validate that the Operations Manager Agent was installed, open Control Panel and verify that the Operations Manager Agent is present. To manually configure the Operations Manager agent, see Configuring Agents.
You can upgrade Service Manager servers in the presence of an System Center 2012 – Operations Manager console.

Source: MS Documentation
http://www.microsoft.com/en-us/download/details.aspx?id=27850